Object Detection
9 min read
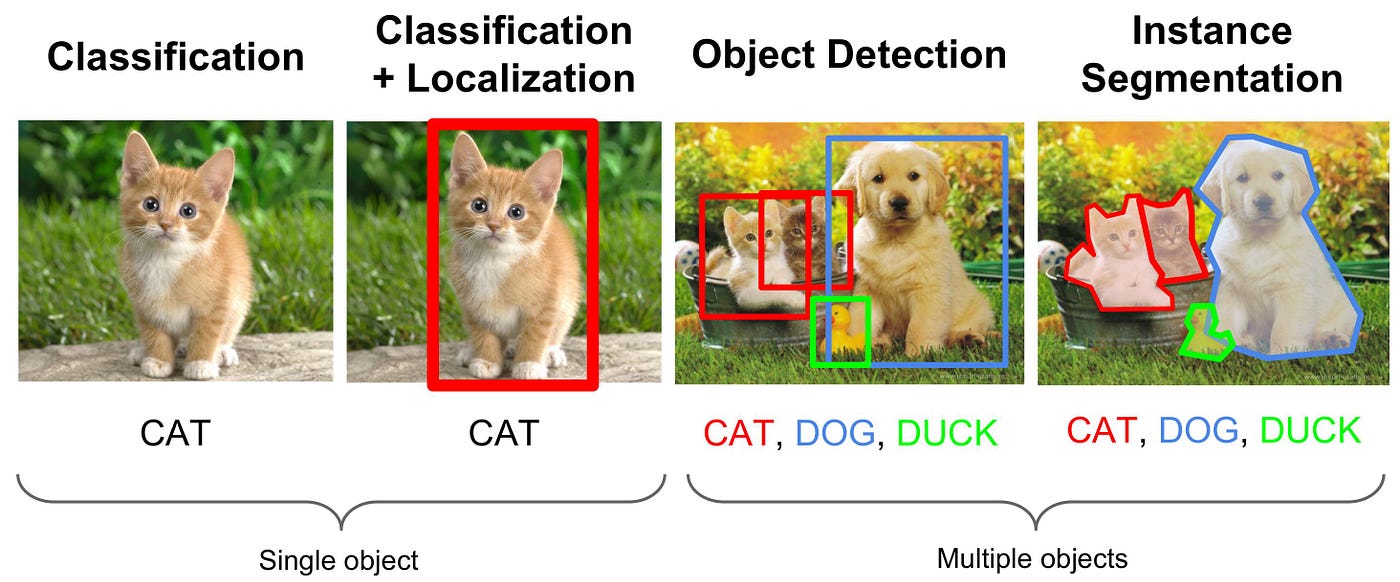
Problem Definition #
We want to detect any objects present in image and localize them using bounding boxes around them. The bounding box will have ,
Where
-> coordinate of initial point
-> coordinate of initial point
-> width of box from
-> height of box from
Since we also need to find what the object of, we also need to find it’s class, for that we also output class label from neural networks.
Traditional Object Detection Methods #
Template Matching + Sliding window approach #
- Generate a template of object and slide it in the image to find it. If the template image match the object in the image, then we create a bounding box around that object.
- Compute the correlation of the pixels of image and template and find how much they correlate each other.
- If the image matches, we get high correlation since we get all the pixels matched.
Problems with Template Matching
-
When the object is hidden partially, then the pixels around them didn’t match, so the system may not detect objects at all.
-
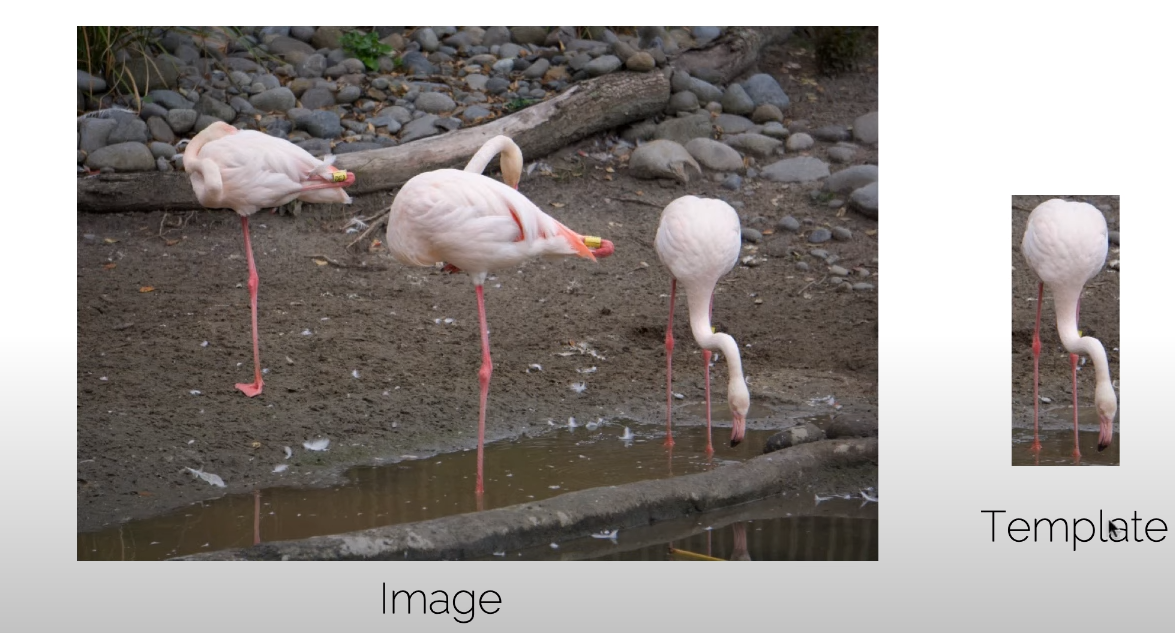
The template image must be of same class and must have same shape and pose to match the object in the image.
For example: Let’s say we have a chair as template and we want to find it in the image but these two chair are different. Then, the template won’t match the object in the image. Also, it should be of exact same size as in the image and must be of same pose as in the image. As we can see in the above image, all the birds are same but their pose and shape are different. So, when we use the template given there, only third bird will be detected.
-
Since the object in the image will be of unknown scale, in the unknown place, the search space will be much higher and used inefficiently.
Feature Extraction + Classification (Voila Jones Detector) #
- The Viola-Jones algorithm was developed in 2001 by Paul Viola and Michael Jones.
- This methods makes many small decisions and combines them to form a stronger final decision.
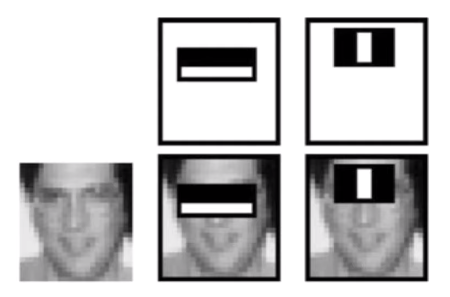
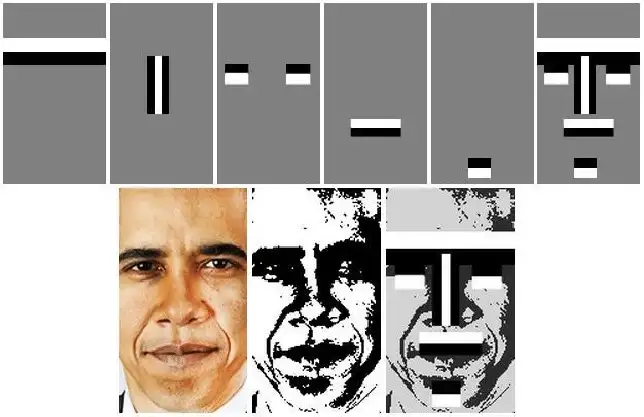
- Here, For Face detection, this methods extracts features from image. As we can see, the horizontal black-white pattern matches perfectly with the eyes and also black-white-black pattern matches eyes and nose vertically.
Working of Viola Jones Algorithm #
- The algorithm needs grayscale image, so first it converts rgb image to grayscale.
- Haar-like features are scalable, rectangular frames that are used to compare how pixels relate to each other; specifically how dark one is to the other. See examples below.
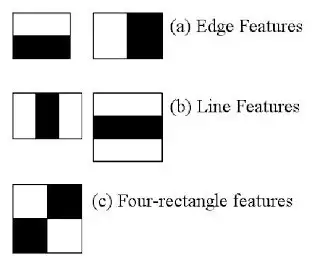
There are basically three haar like features which are: Edge features, Line features and four-rectangle features. The white bar in these features represents that, that part of image will be light than that with dark bar. That’s the reason the image is first converted into grayscale image.
Edge features: These frames detect edges (simple enough). When it comes to face-detection, think of the forehead and the eyes/eyebrows. The forehead is an exposed, flat surface of the face. This allows it to reflect more light, so it is often “lighter”. Eyebrows are generally darker. The algorithm would read the lighter shade of the forehead and the transition to the darker eyebrows as an “edge” boundary.
Line Features: Line features detects lines. These features are white-black-white or black-white-black. For human faces it can be eyes-nose-eyes, as eyes are a bit darker in shade and nose will be whiter compared to eyes.
Another interesting way that Line features are being utilized is in eye-tracking technology. Think about it: a darker iris sandwiched between the white space of your eye on either side of it.
Four Rectangle Features: These features are used in finding diagonal lines in an image. Depending on the lighting, it can pick out the edges of the jaw, chin, wrinkles, etc.. These typically are features that aren’t as important in general face-detection as there are so many of them, as well as so many variations in every individuals face, that it would lead to an algorithm that was too slow and might only detect the faces of certain people. In other words, too specialized.
Now to find whether the selected feature is right or not, we perform certain tests. Basically, we set some threshold and then add all white pixels and black pixels separately and subtract black pixels from white pixels. If the difference is greater than threshold, then the feature is correct else it failed in the test and we discard it.
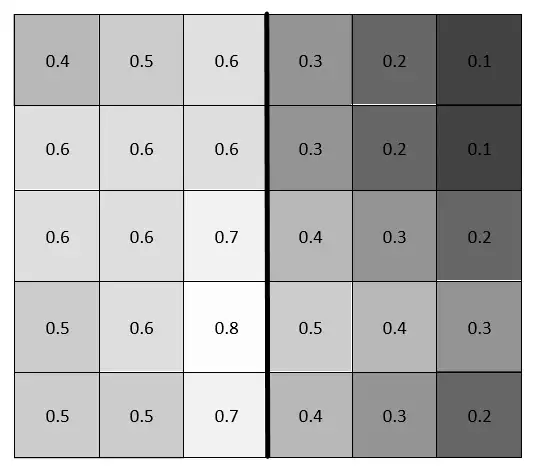
Here in the image above, if we add all white pixels, we get 0.58667 and that of black pixels 0.28 on subtracting we get 0.30667. Let’s say we had threshold of .25 then the feature is a good feature and we pass it.
But subtracting, adding these pixels takes a lot of time and it won’t be efficient. So, to get over that they have introduced integral image.
Integral Images:
What is an Integral Image anyway? Well, it’s an array whose values are the sums of values of an image. What values, though? And how is it arranged in any meaningful way? Let’s just make one. It’ll be easier to understand when we see it.
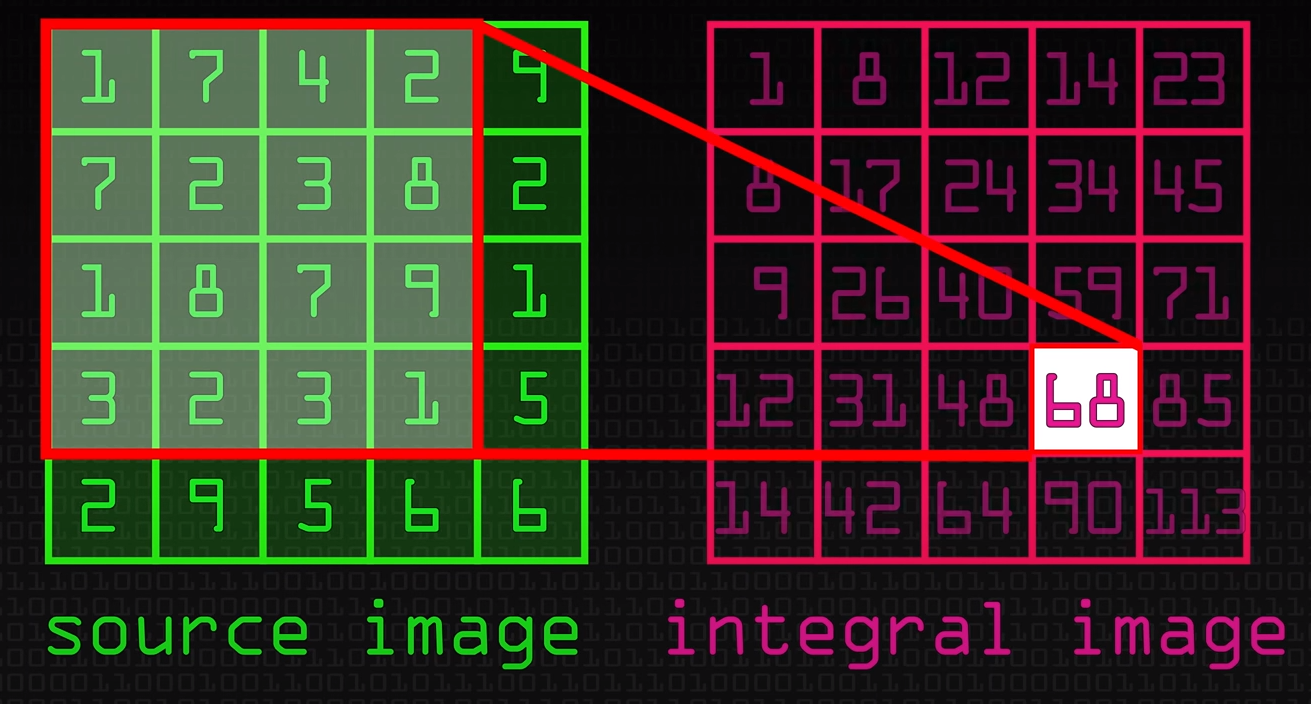
Since, we do a lot of subtracting and addition while detecting faces using haar features, we create a image that uses sum of previous pixels for each pixel as given in the above feature. That way it will be easy to calculate the values without much operations. This image is called integral image.
Applying Integral Images to Haar-Features
So how does this work with the Viola-Jones algorithm? Let’s take a look at the original image again.
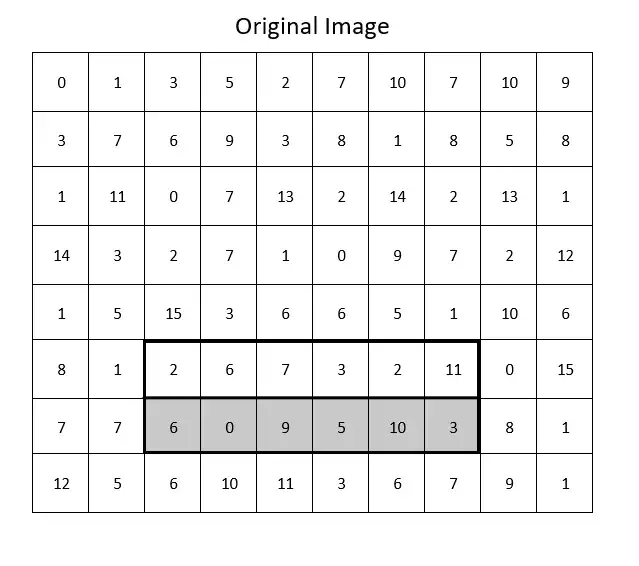
The frame here represents an Edge feature. The algorithm needs to calculate the means of the lighter and darker halves and subtract them to see if the difference falls within the threshold. For the sake of the argument, let’s say that our threshold is 10 (remember that we’re interpreting the values in the array as if they were still on a scale of 0 to 255). So it creates the integral image.
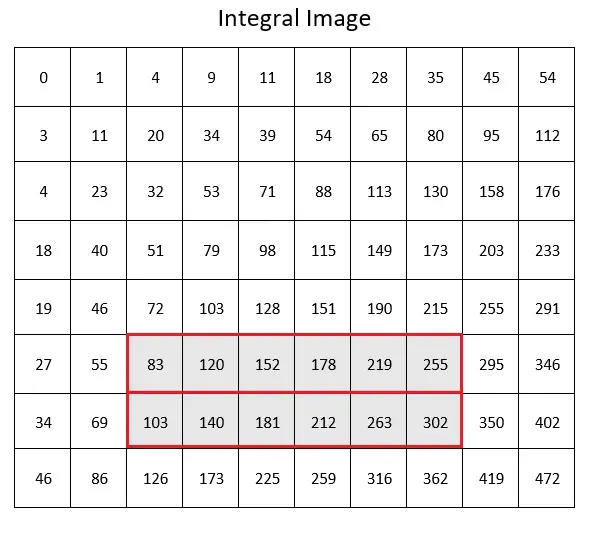
Then it calculates the sum of the lighter half by finding the four relevant numbers.
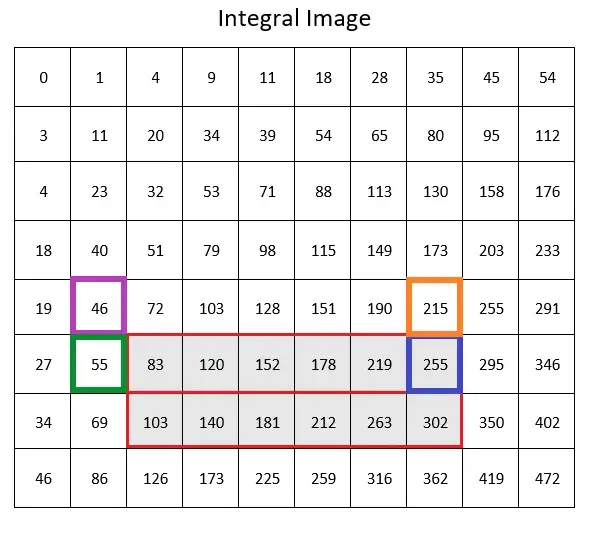
Taking this sum, the algorithm calculates the mean by dividing it by the number of columns in the frame.
Now, it follows the exact same steps to find the mean of the darker half
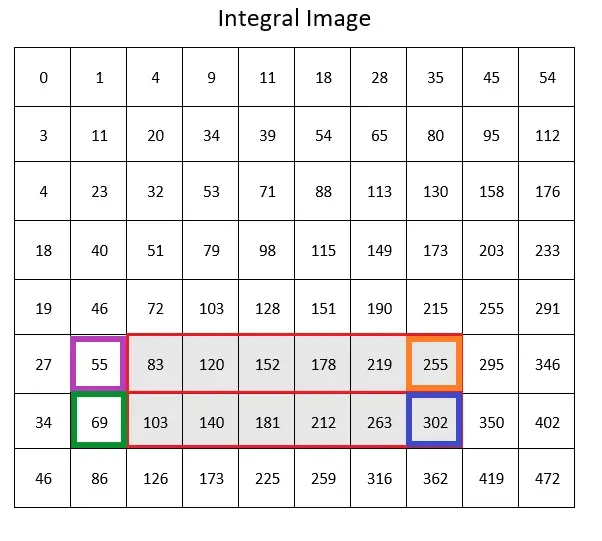
Now, it subtracts the means to see if it falls within the threshold.
This falls way outside of our threshold and the algorithm determines that there is no Edge feature in this portion of the image and moves on.
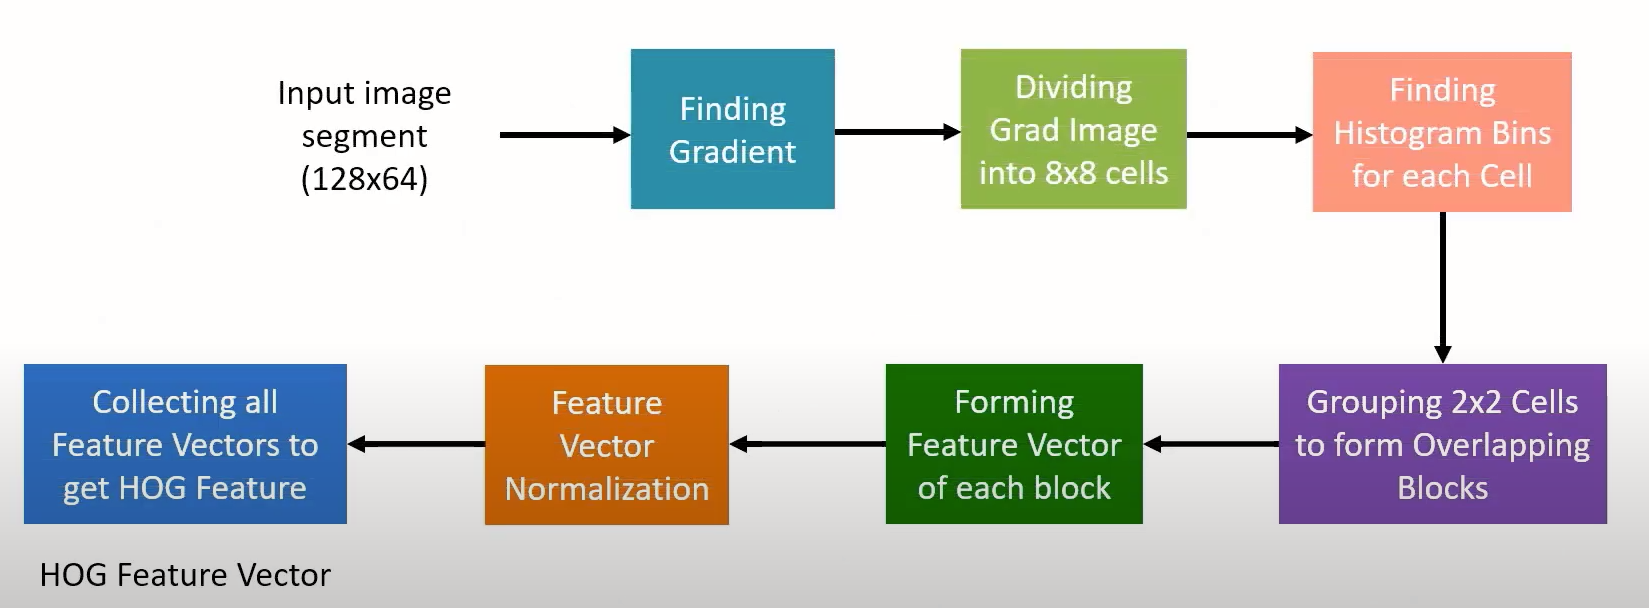
Histogram of Oriented Features (HOG) #
Non Maximum Supression (NMS) #
while the region proposals propose many boxes around objects, we need some method to eliminate the ones not having much information about object or are just duplicate of the other ones and only Keep the best ones. The method of removing such boxes and keeping only the best ones is called Non-Maximum Supression.
We use IoU(intersection over union) to decide which box to keep and which to remove. Intersection over union measures whether two boxes are overlapped or not. It is also called Jaccard index.
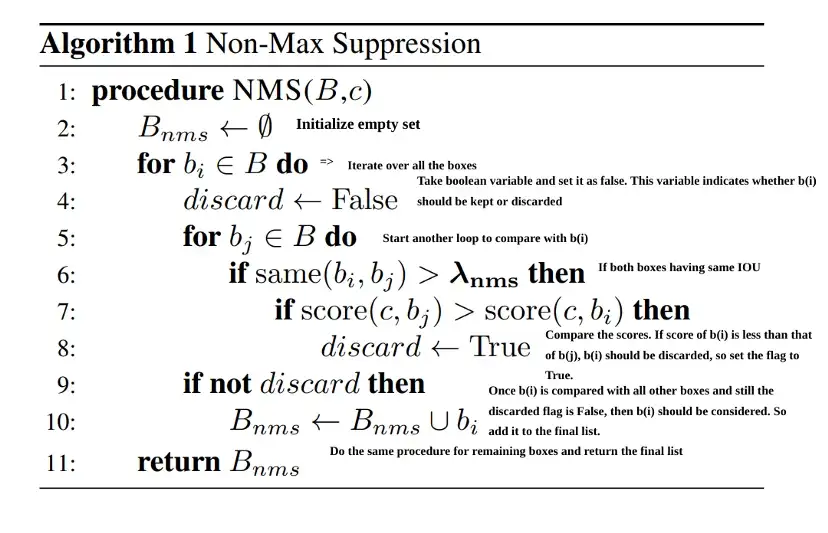
Input: A list of Proposal boxes B, corresponding confidence scores S and overlap threshold N.
Output: A list of filtered proposals D.
Algorithm:
- Select the proposal with highest confidence score, remove it from B and add it to the final proposal list D. (Initially D is empty).
- Now compare this proposal with all the proposals — calculate the IOU (Intersection over Union) of this proposal with every other proposal. If the IOU is greater than the threshold N, remove that proposal from B.
- Again take the proposal with the highest confidence from the remaining proposals in B and remove it from B and add it to D.
- Once again calculate the IOU of this proposal with all the proposals in B and eliminate the boxes which have high IOU than threshold.
- This process is repeated until there are no more proposals left in B.
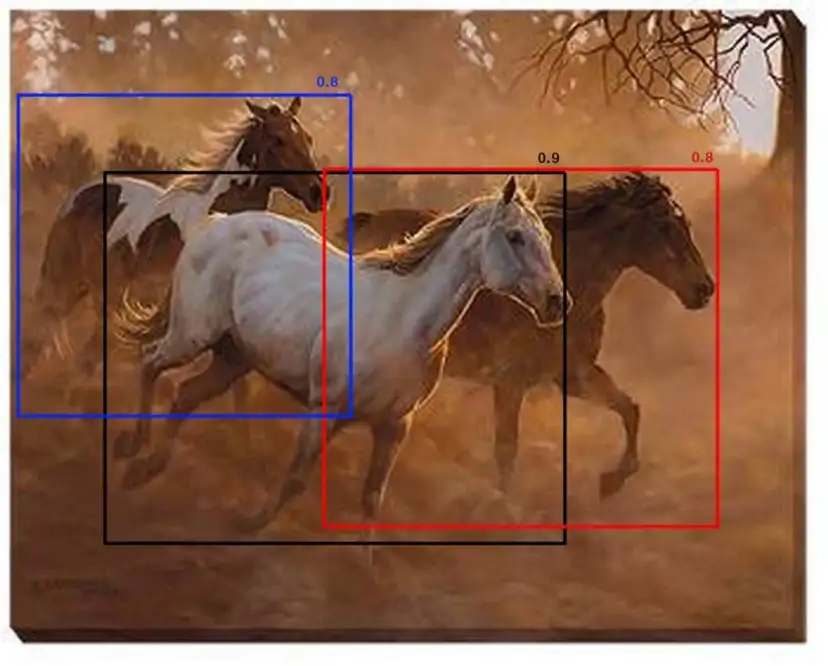
But, what will happen if there are multiple objects in the image and all boxes have different confidence scores? Now, all the boxes overlapping will be removed based on the IoU score, but is this right to do? No. Let;s see an example:
Assume that the overlap threshold N is 0.5. If there is a proposal with 0.51 IOU and has good confidence score, the box will be removed even though the confidence is higher than many other boxes with less IOU. Because of this, if there are two objects side by side, one of them would be eliminated. A proposal with 0.49 IOU is still kept even though its confidence is very low. Of course this is the known issue with any threshold based technique. Now how do we deal with this? Below is an example of such case. Only the proposal with 0.9 is kept and others will be removed. This reduces the precision of the model.
The simple yet efficient way to deal with this case is to use Soft-NMS. The idea is very simple— instead of completely removing the proposals with high IOU and high confidence, reduce the confidences of the proposals proportional to IOU value.
Now let us apply this idea to the above example. instead of completely removing the proposals with 0.8 score, keep the proposals but reduce their score as shown in the figure below.
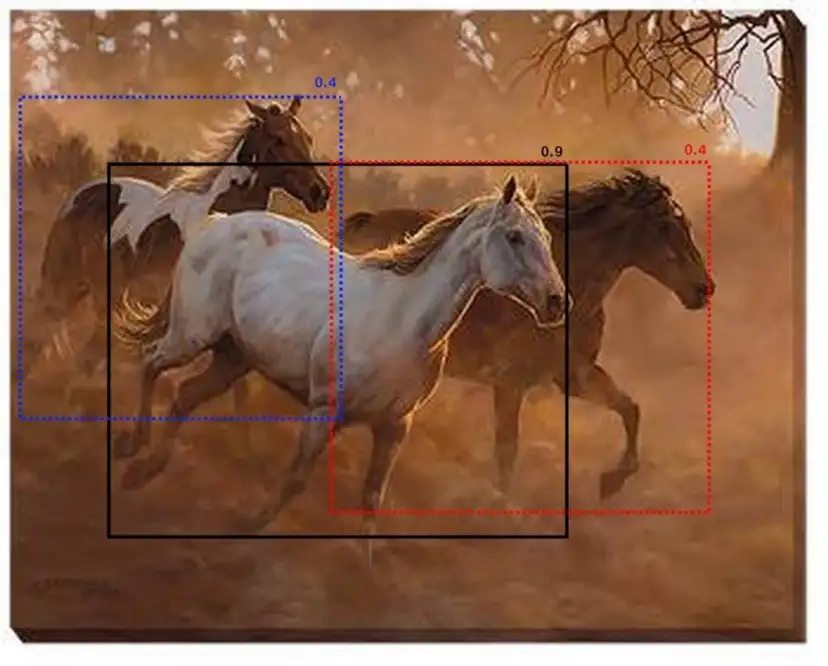
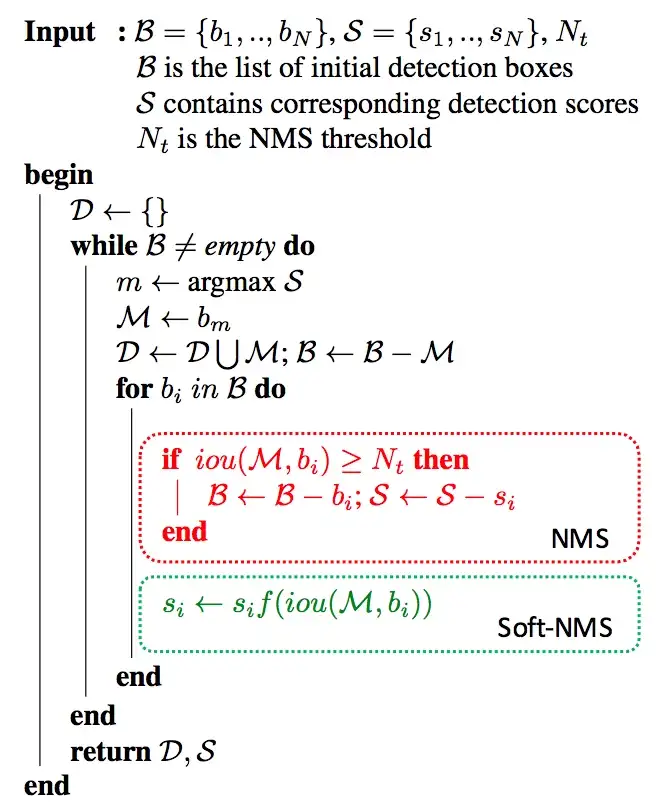
As I have mentioned earlier, the scores 0.4 of both the proposals are calculated based on the IOU values. The score calculation is as follows
Where,
— score of proposal
— box corresponding to proposal
— box corresponding to maximum confidence
— IOU threshold
Algorithm from Soft-NMS paper:
References #
- CV3DST - Object Detection 1
- Detecting Faces (Viola Jones Algorithm) - Computerphile
- What are Haar Features used in Face Detection ?
- Haar-like Features: Seeing in Black and White
- The Integral Image
- HOG Features (Theory and Implementation using MATLAB and Python)
- HOG(Histogram of Oriented Gradients)
- Improving Object Detection With One Line of Code
- Non-maximum Suppression (NMS)